
Resolving High Disk Space Utilization in MongoDB
Problem
We have recently received many alerts about high disk usage on MongoDB Atlas for the past two weeks.
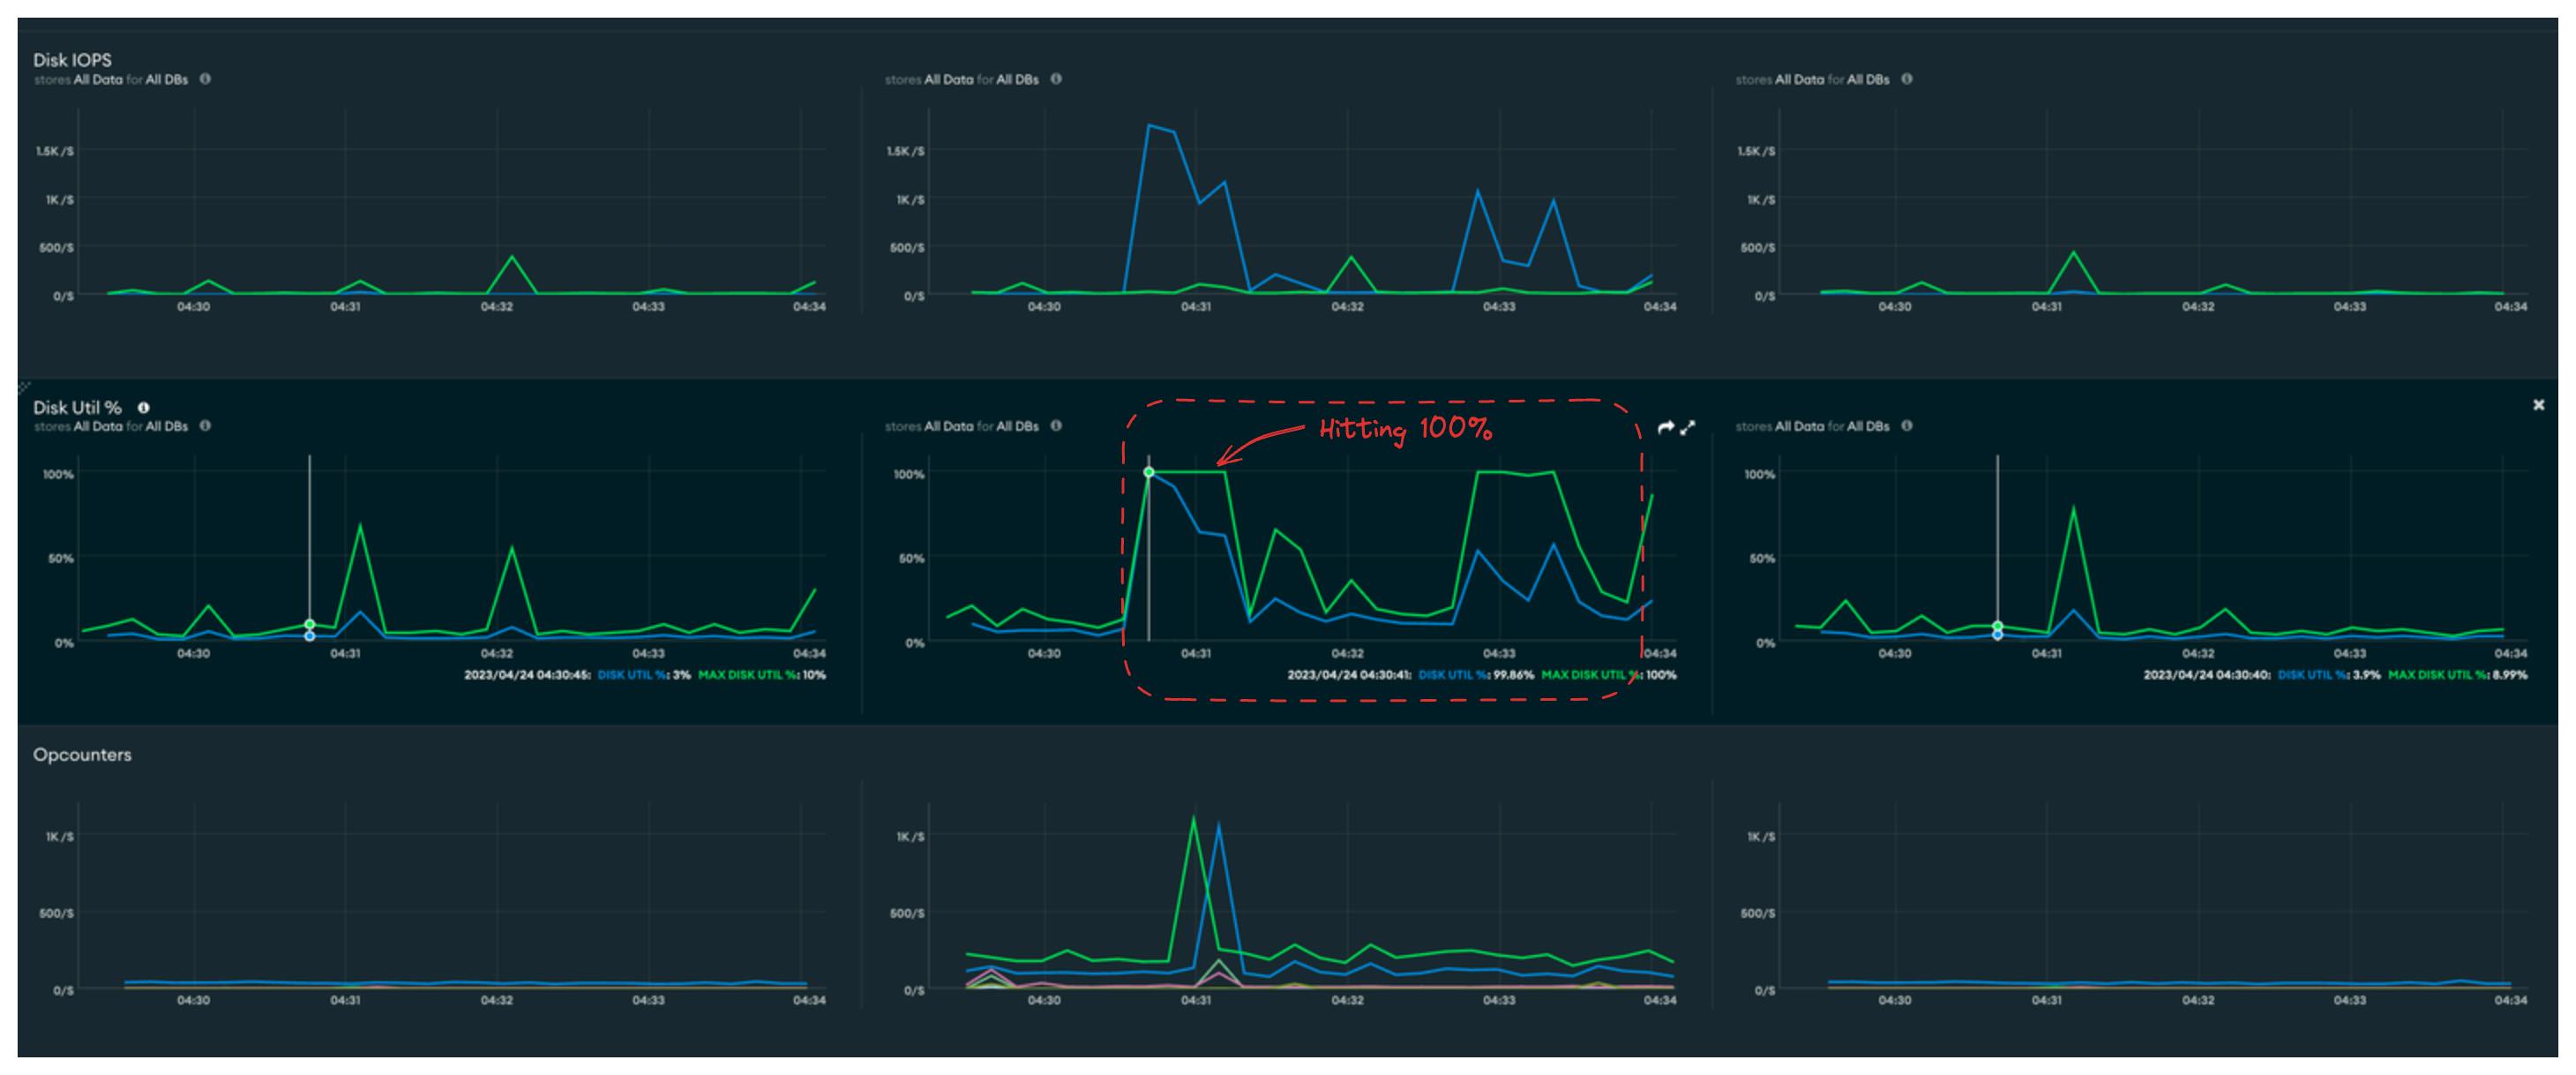
According to docs, Disk utilization % on Data Partition occurs if the percentage of time during which requests are being issued to any partition that contains the MongoDB collection data meets or exceeds the threshold. The downside of the Disk Utilization being high is the DB cannot process other queries if it maxes out. This can lead to data loss or inconsistencies.
These are how the metrics looked like in one of the last alerts. From the graph, Disk Util % at 4:30UTC was around 99.86%.
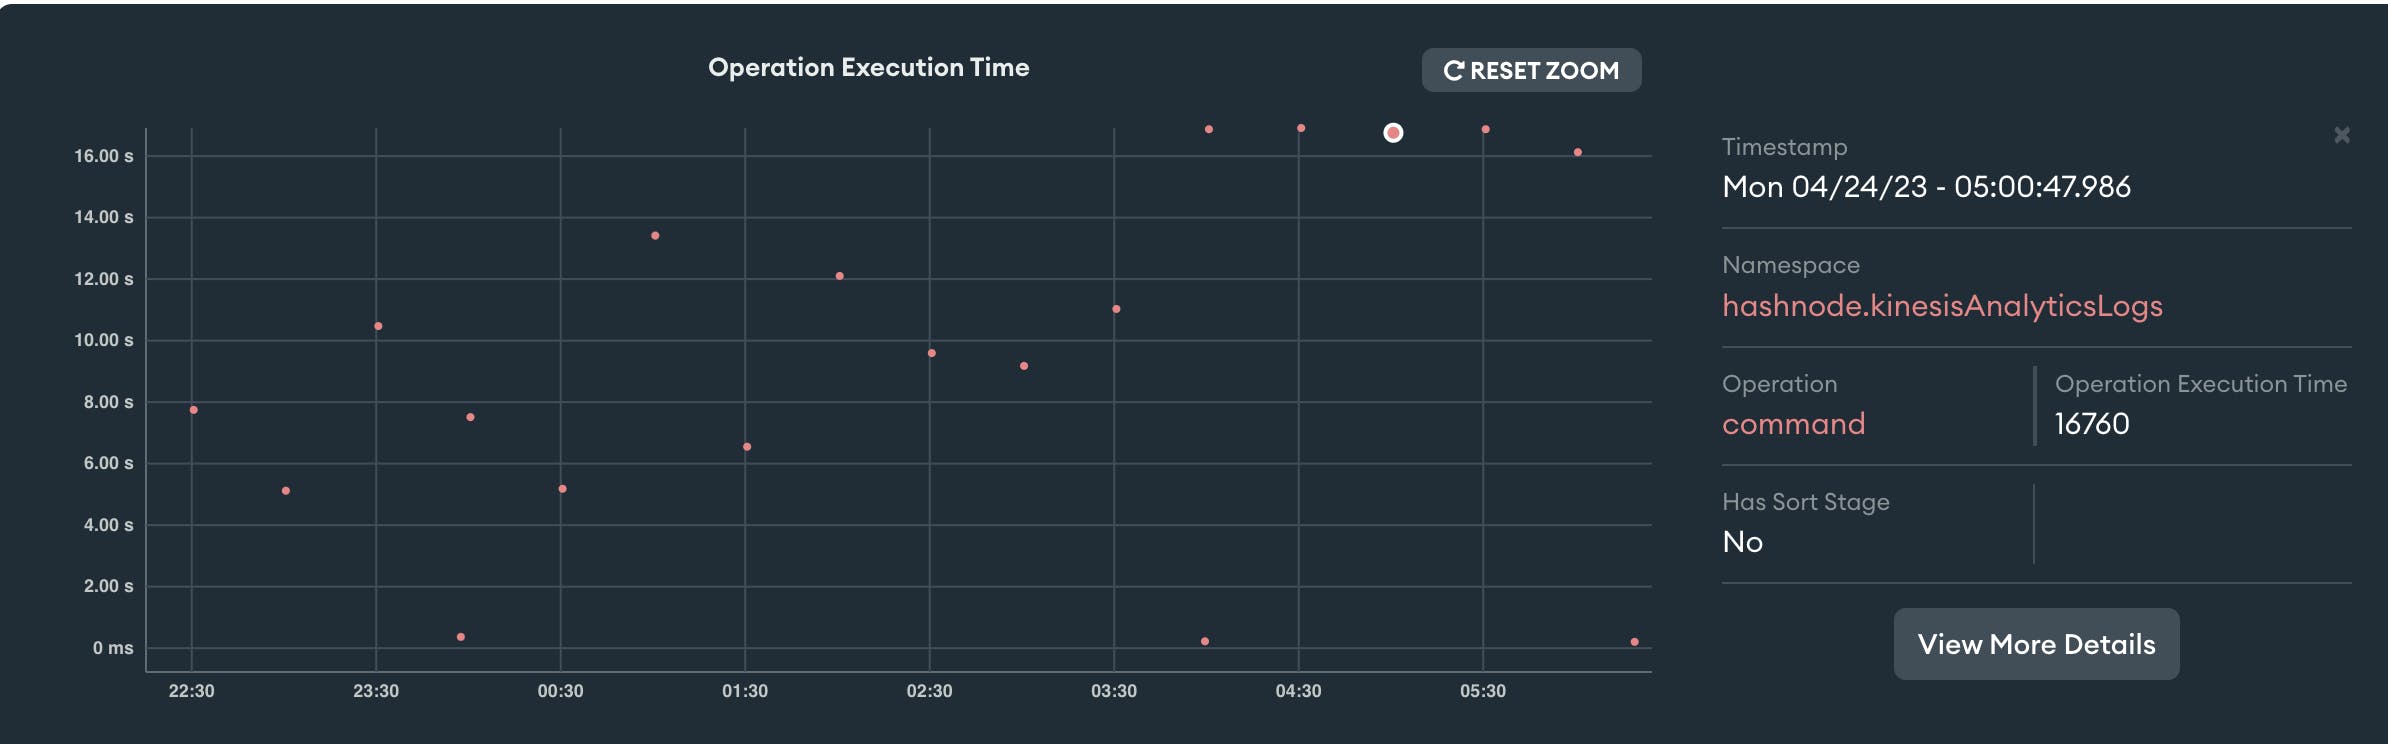
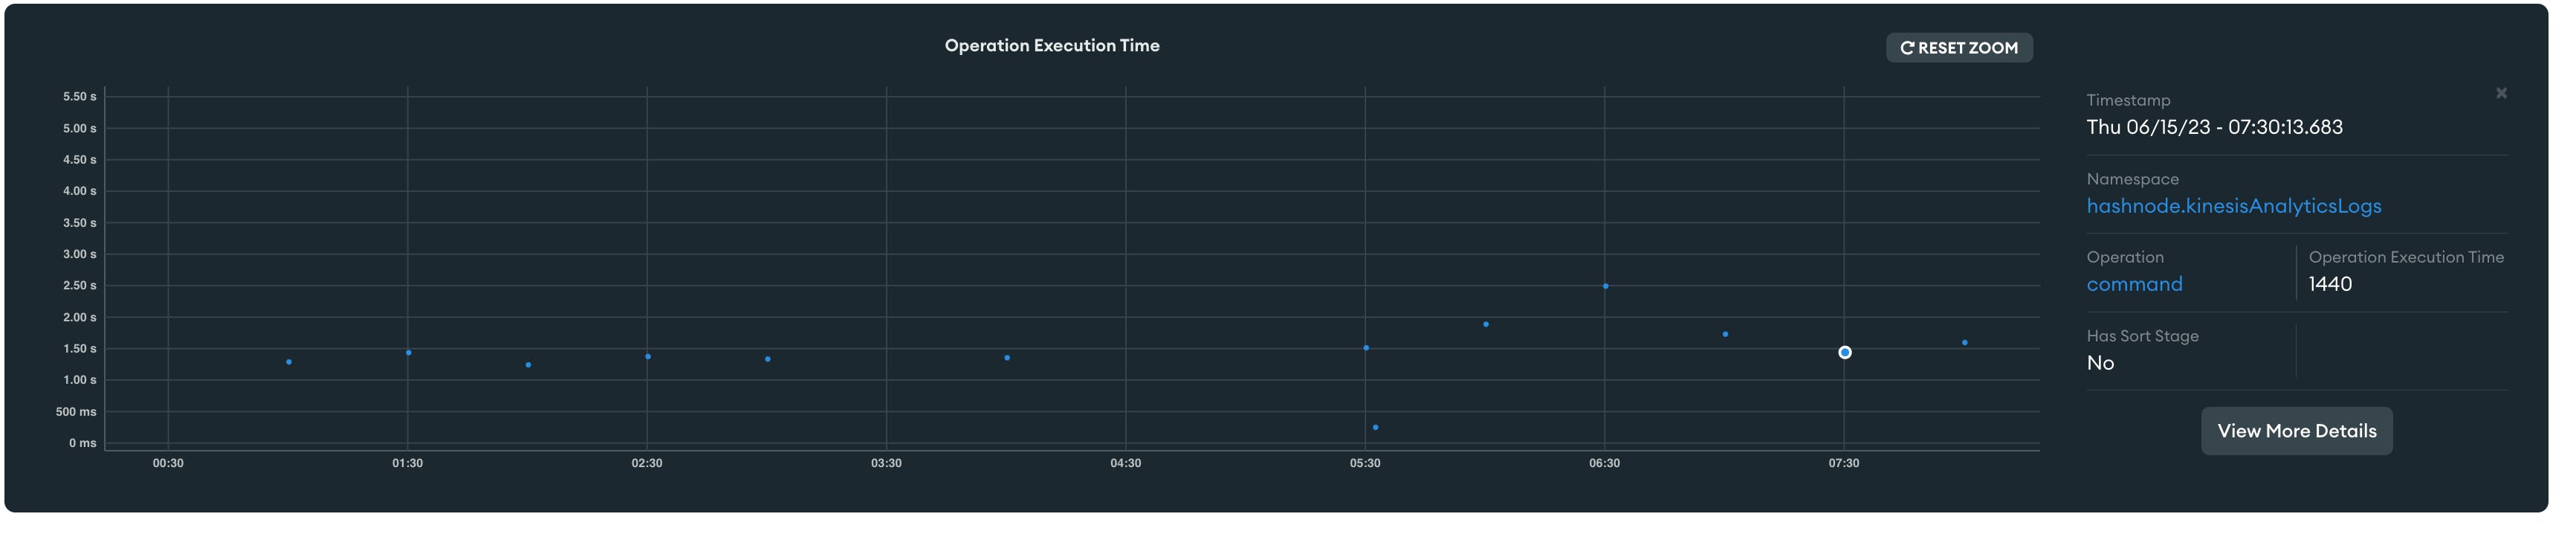
Checking the profiler, we can notice a query that's running during the same time, and it takes around 17s to resolve!
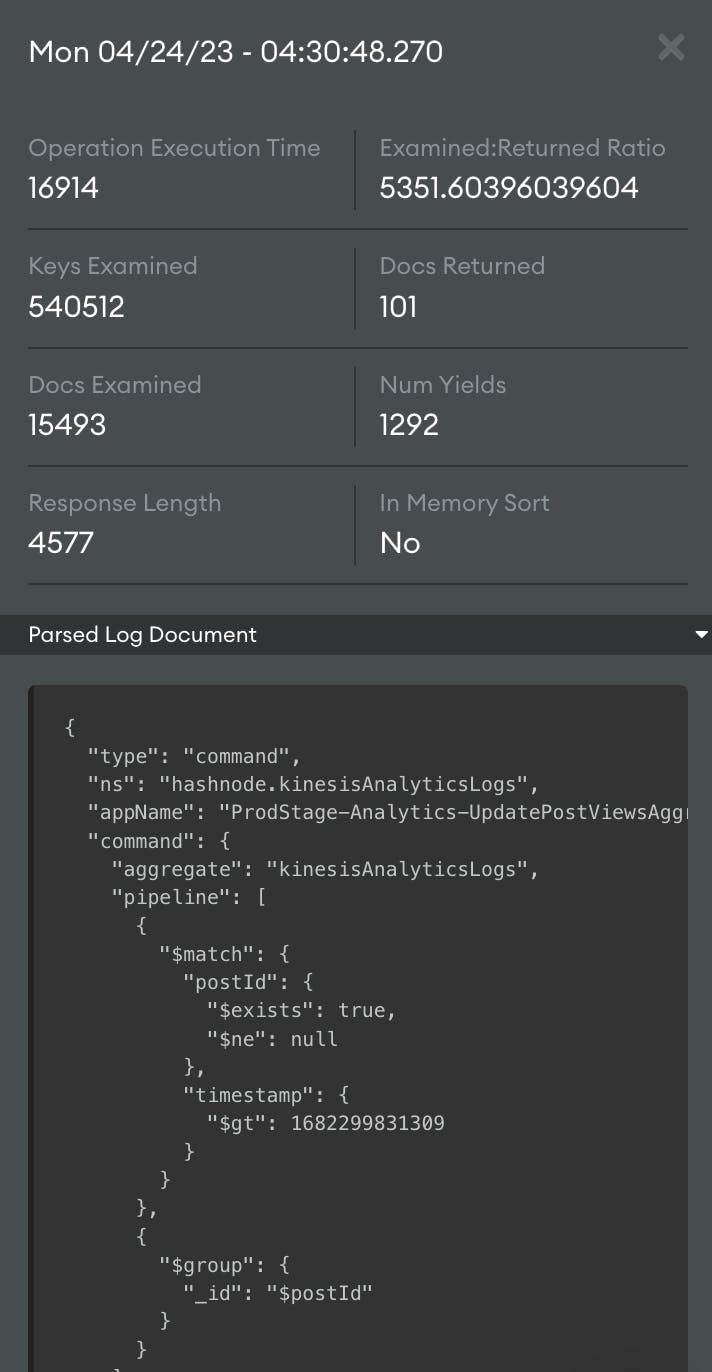
This query is related to a KinesisAnalyticsLogs collection. The collection internally is used to record views of different posts. The mentioned query already makes use of an index and still takes that much time to resolve because of the sheer size of the collection.
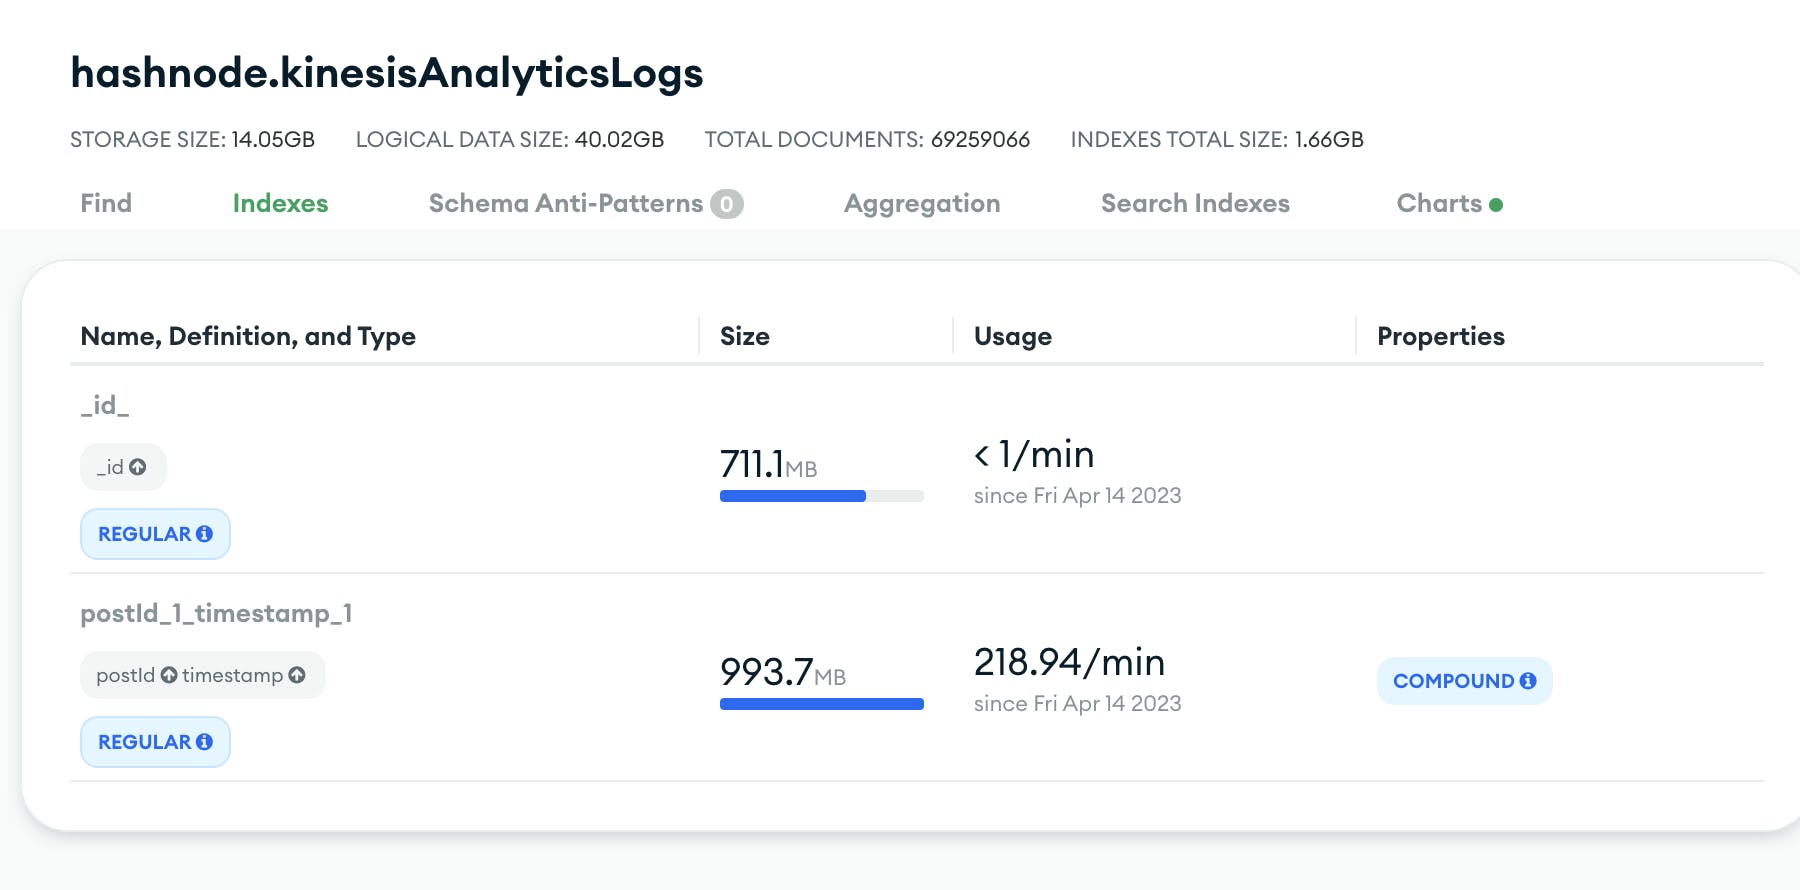
The total number of documents is close to 70 million, and the index size itself is close to a GB! That seems to be why it takes so long to resolve. Since this collection was recording analytical data, it was bound to reach this volume at some point. Along with that, from the profiler image, we can see that the query has yielded ~1300 times. According to docs, if a query yields a lot, then it is hitting a disk a lot. If we want that query to be faster, then the data needs to be in memory (index).
Upon digging further, this query is scheduled to run every 30mins to sync the views. So we can correlate high query times on the profiler and Disk IOPS peaking almost simultaneously.

Solutions
Based on the investigation, we came up with two solutions:
Short Term Solution
Since the collection size is a problem, and we are not using older data, deleting records older than a month will reduce the collection size drastically, leading to a smaller index size and faster query resolution.
We can also add
TTLto the records inkinesisAnalyticsLogscollection (https://hashnode.com/rix/share/sg4lYYf_M). It'll automatically delete the records older than a month going forward. This will make the index smaller and lead to a shorter query time.
Long Term Solution
Data like views/analytics should not be stored in the same place as the core business data. This collection will keep growing by the minute since it records the views. Some other DB should be used that's more appropriate for it.
Implementation
We decided to go with the short-term solution for now and added the long-term solution as a future task. For starters, we added TTL indexes immediately. With this, all the future records that will be created will be automatically deleted after the expiry time. This index can only be set on a field type date
kinesisAnalyticsLogSchema.index({ dateAdded: 1 }, { expireAfterSeconds: 2592000 });
To delete the past records, we ran a script that can delete all the records older than a month. Since we were deleting huge amounts of data within a short span, we encountered some problems while running the script. We had to keep a close eye on some of the metrics so that it didn't lead to a DB restart.
CPU% spikesA large number of record deletions were leading to CPU% usage over 95. We had to be careful and gave enough breathers in between to the DB.Replication Oplog Window has gone below 1 hourThis was a new alert that we came across. Since our instance had one primary and two secondary DBs (replicas), the secondary DBs require enough time to replicate the writes from the primary. We had to be careful not to go below the recommended 1-hour window.
After carefully running the script, this is how the overall collection looked like

This was almost 2-3 days of effort to run the script and observe how the DB was performing. We finally were seeing the difference. The query resolution was fast enough for a background aggregate task, and it was not creating the disk util alerts 🎉
Overall improvements:
Average query time went down to 1.5s from 15s
The index size went down to ~400MB from ~1GB
The collection size went down to ~9GB from ~40GB